Key Highlights
- Bitcoin price started an upside correction from the $15,450 zone.
- It cleared a major bearish trend line with resistance near $16,270 on the 4-hours chart.
- The price could struggle to clear the $16,800 and $17,000 resistance levels.
- Crude oil price failed to surpass $82.50 and started a fresh decline.
Bitcoin Price Technical Analysis
Bitcoin price started another decline below the $16,000 level. However, BTC/USD remained well near $15,500 and the bulls protected additional losses.
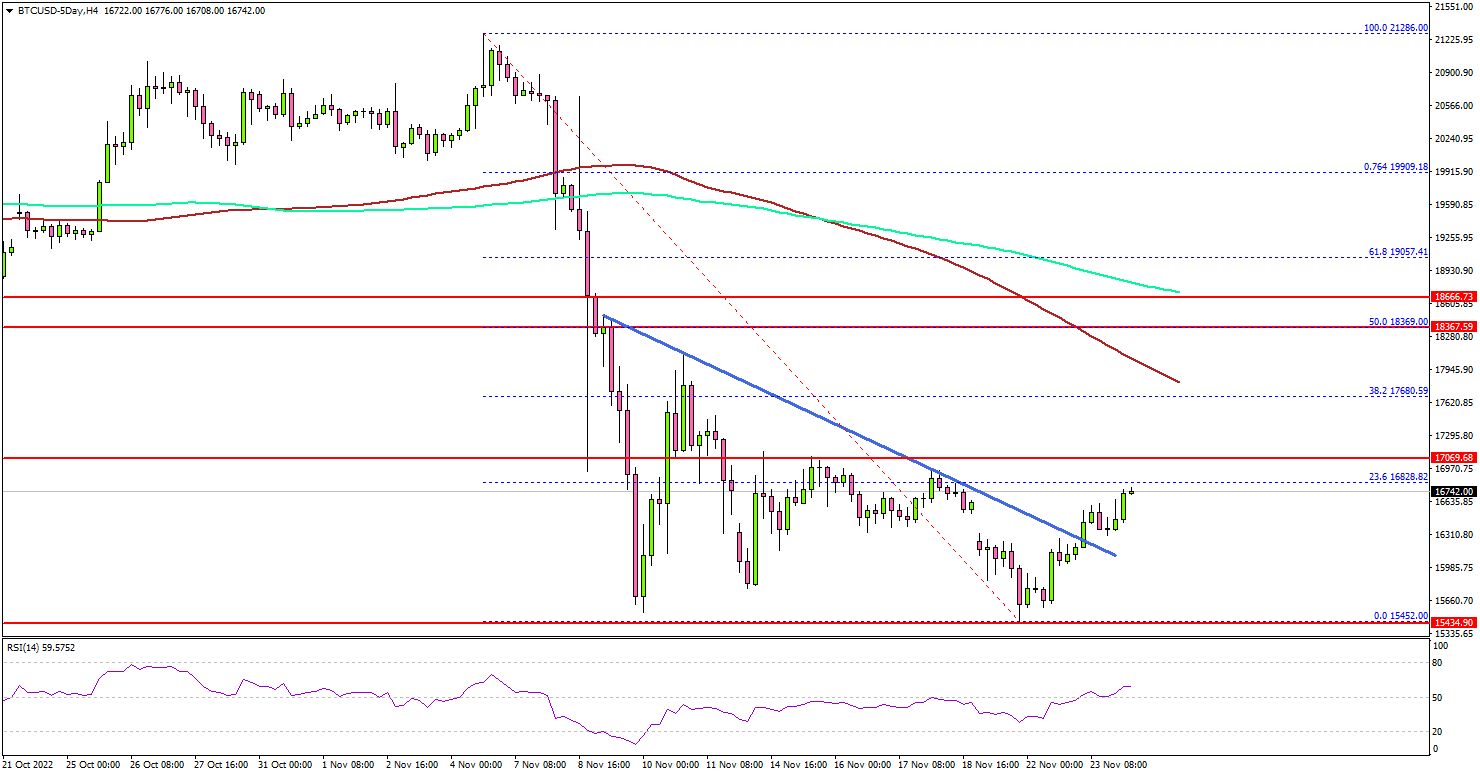
Looking at the 4-hours chart, the pair traded as low as $15,452 and settled below the $17,000 level, the 100 simple moving average (red, 4-hours), and the 200 simple moving average (green, 4-hours).
Bitcoin price started a recovery wave above the $16,000 resistance zone. There was a clear move above a major bearish trend line with resistance near $16,270 on the same chart. An immediate resistance is near the $16,820 level.
The 23.6% Fib retracement level of the key move from the $22,286 swing high to $15,452 low is also near $16,820. The next resistance sits near the $17,000 zone.
A close above the $17,000 level may perhaps start another steady increase in the coming days. In the stated case, the price could rise towards the $18,350 level. It is near the 50% Fib retracement level of the key move from the $22,286 swing high to $15,452 low.
Any more gains could set the pace for a move towards the $19,000 level. On the downside, an initial support sits near the $15,850 level. The main breakdown support sits near the $15,500 zone. If there is a downside break and close below $15,500, bitcoin might start another major decline in the coming days.
Economic Releases
- German IFO Business Climate Index for Nov 2022 – Forecast 85, versus 84.3 previous.
- German IFO Expectations Index for Nov 2022 – Forecast 77.0, versus 75.6 previous.