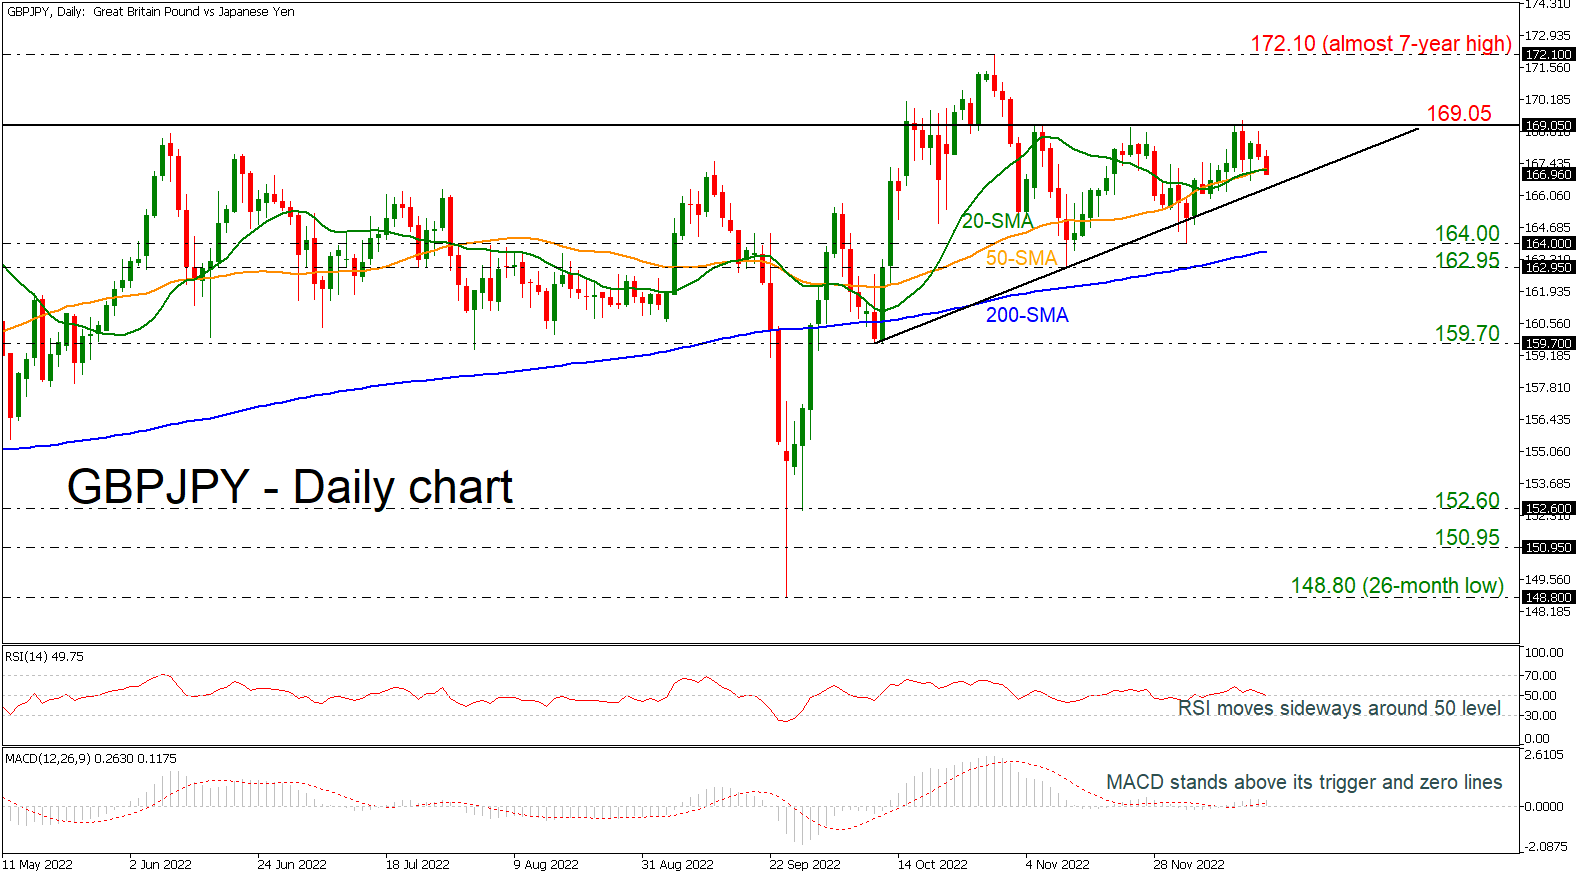
GBPJPY reversed to the downside to test its short-term simple moving averages (SMAs) after the pullback off the 169.05 barrier.
Although the pair has been printing higher lows above September’s trough, it was unable to find enough buying power to chart new highs. In other discouraging signals, the RSI is pointing downwards near the neutral threshold of 50, while the MACD is moving with weak momentum near its trigger and zero lines.
Should the pair stretch south and break the upward line, it may find immediate support at the 164.00 round number and then near the 200-day SMA at 163.65. A significant step lower could worsen bearish sentiment, sending the price probably to 162.95. Then, a sharper decline could follow towsards the 159.70 support.
On the flip side, the 169.05 obstacle may halt again bullish actions, preventing a rally towards the almost seven-year high of 172.10. If traders continue to buy the pair, the price could rise until the inside swing low from April 2015 at 175.00.
In the short-term picture, GBPJPY is trading within an ascending triangle. While the formation is a bullish signal, traders will wait for a climb above 169.05 before they drive the pair higher. Alternatively, a break below the diagonal line could renew selling pressures.